

The 2019 Global Internet Phenomena Report is almost in the bag, so it is time to start the pre-report series of blogs where I "leak" data out from the report — we might even call this the "Hidden Cam Show," where I expose data for the whole world to see! The Internet Phenomena data this year is even more interesting than last year (at least to me) and the first spotlight is (unsurprisingly) about video.
 Streaming video is once again the dominant source of internet traffic, comprising over 60% of total downstream traffic volume. The usual suspects are major players in the game — Netflix, YouTube, Amazon Prime, social networking video, and a very long tail of streaming content providers worldwide. This year, however, we are seeing native IPTV streaming from the network operators begin to make up a statistically significant percentage of all streaming video, as consumers that are not cutting the cord are streaming video-on-demand (VOD) and live TV in their homes.
This trend accelerated during 2019, which is interesting because the overall share of video is not terribly different than last year (when it was a little over 58%), but the composition of that video traffic has shifted (you will have to stay tuned for the exact numbers 😉 — allow me some tension building!).
As I was looking through the data, I broke the video out into three categories for some further exploration:
- Over-The-Top (OTT) Video: Includes not only Netflix, Hulu, Amazon Prime, but also live OTT traffic like PlayStation View, Slingbox TV, etc.
- Operator Video: VOD or live streaming from your cable, fiber, or DSL provider
- Social Video: YouTube, Twitch, TikTok
The graph below shows how over the first six months of 2019, video traffic shifted from social video to operator video, while OTT video remained fairly constant.
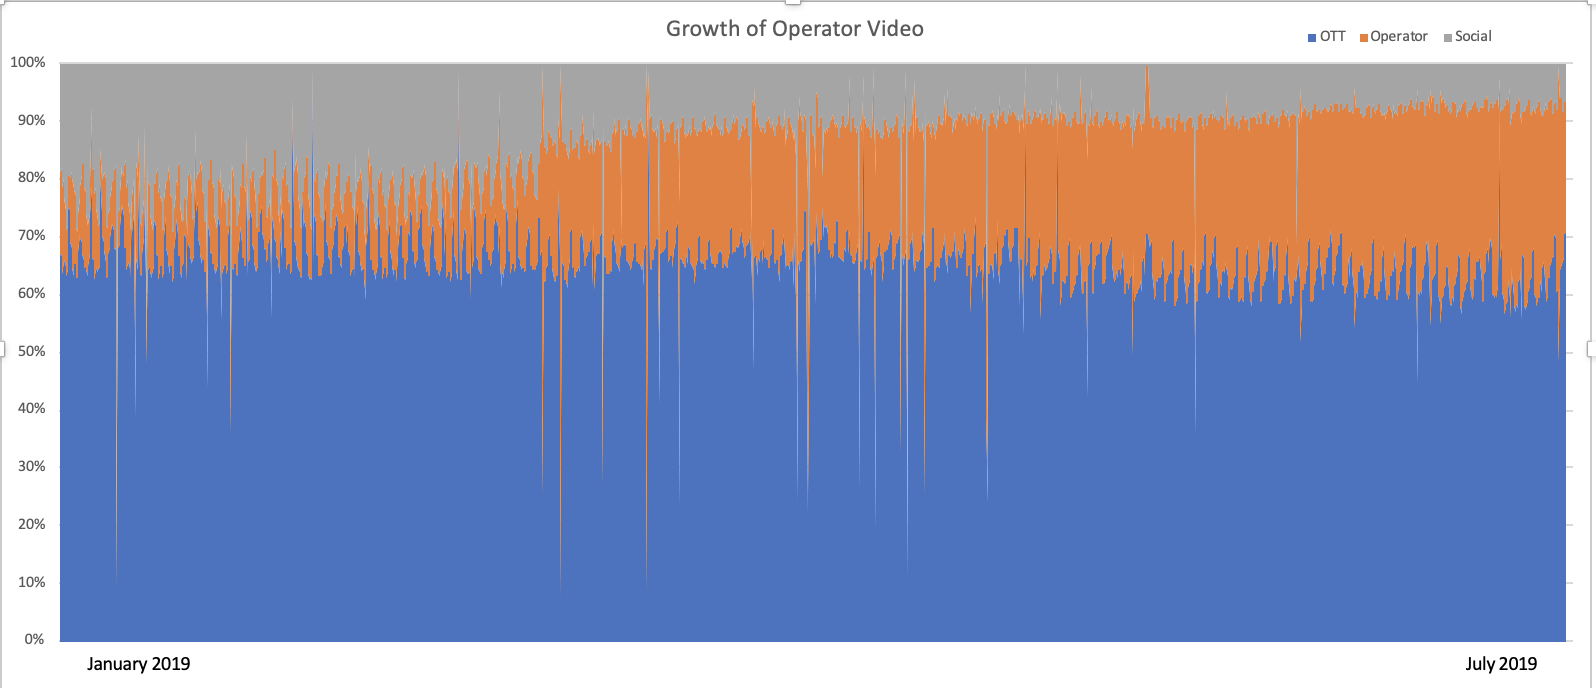
This shows operator video steadily eating into the viewing of social video on fixed line networks as the casual viewing option in the home. The three interpretations of this graph are either:
1) The casual viewing of video on non-TV devices in the home (not while on mobile) has shifted from social video to catch-up and VOD offerings from network operators.
2) Casual viewing on set-top boxes is increasingly shifting to IPTV as consumers upgrade their cable boxes to systems that leverage IPTV rather than traditional broadcast methods.
3) Network operators that have deployed Sandvine now consider IPTV traffic critical enough that they are now "mainstreaming" the traffic to run through our solutions (where they may have been bypassing our systems due to the high bandwidth used by these streams). (NOTE: I don't think this is the answer because if it was, the total volume of video traffic would have grown a statistically significant amount, but I am including this for completeness.)
No matter which option above is the correct answer, this shows that OTT watchers tend to stay on their OTT services, and those that are not OTT are simply changing their viewing habits. There has been a small decrease in the OTT from January to July, but it is within the statistical margin of error that I use to judge the data.
There are other follow-on conclusions from the details of this data. If you stay tuned over the next two weeks, I will share more details into the composition and changes in streaming video in the 1H of 2019, as there are some big changes afoot!
Download the report now!


Topics: Netflix, Video Streaming, Streaming Video, Global Internet Phenomena, HBO