



The most common challenge telecom service providers face is top-line growth. Revenue growth depends on net subscriber additions, not gross additions alone. When fewer subscribers leave, more new sales increase the total subscriber base instead of replacing customers who have already left.
Effective churn management protects recurring revenue and allows new customer additions to grow the subscriber base instead of replacing customers who leave.
AppLogic Telecom Churn Analytics connects actual application experience through App QoE, network KPIs, usage patterns and available customer context to show where churn is limiting revenue growth and why.

How Customers View the Value They Receive
Some subscribers receive high quality technical experience, but still leave because the service, plan, price, or brand does not match what they value. Whether the gap reflects actual service value or customer perception, the subscriber’s view drives the decision. AppLogic examines customer context alongside application interests and usage patterns to identify segments that may see a value gap.
These insights help Marketing, Product, Retention, and Customer Experience teams understand which groups may need a better plan, more relevant communication, or a service proposition that fits how they use the network.


Whether the Actual User Experience Is Good or Bad
Subscribers judge the network through the applications and services they use. AppLogic App QoE measures that experience on a 1.0 to 5.0 scale to show when poor application performance, congestion, coverage, a device, or another technical condition may be contributing to churn.
These insights go to Network Operations, Planning, Technical Support, and Customer Care so they can investigate the cause, prioritize the affected segment, and select an appropriate response.
AppLogic brings over 10,000 data points in the form of psychographic, demographic, geographic and behavioral patterns together in one analysis. It compares these signals with historical churn to identify meaningful segments and the conditions associated with them.
Telecom Churn Analytics runs daily, refreshing churn patterns, causes and results, so teams can identify emerging issues and measure whether completed actions are changing subscriber outcomes.
Value Related Churn Findings
Marketing, Product, Retention, and Customer Experience teams can use value-related insights to improve or create more attractive service plans, refine customer communication, or address a product gap for a newly discovered segment.
User Experience Findings
Network Operations, Planning, Technical Support and Customer Care explore user experience-related insights to prioritize network work, investigate device or CPE issues, or improve troubleshooting.
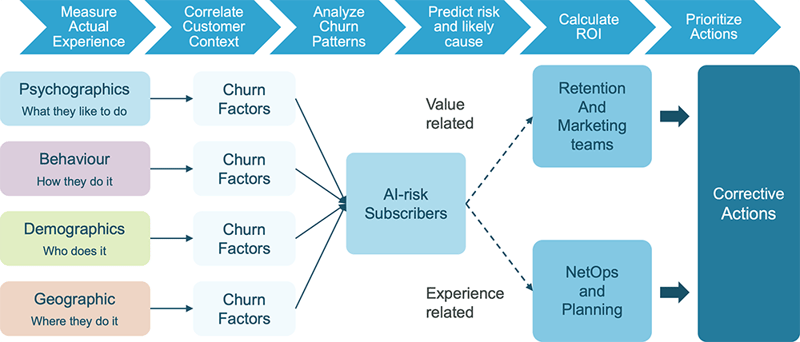
Once Telecom Churn Analytics identifies the historical patterns and causes associated with subscriber loss, Churn Prediction applies those findings to the current subscriber base. Operators can identify which segments are at risk now, understand the likely cause, and prioritize action based on expected revenue impact.