

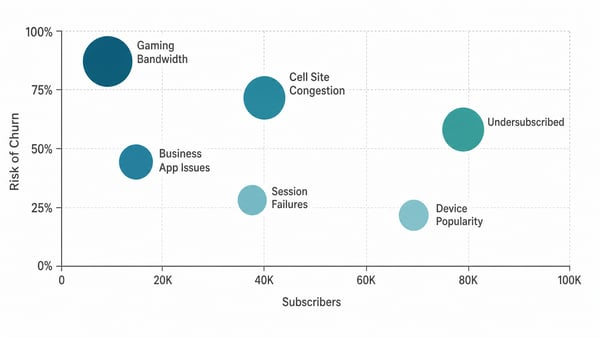
AppLogic Networks Telecom Churn Prediction applies patterns found through Churn Analytics to the current subscriber base. It identifies current subscribers and segments with elevated churn risk, explains whether the likely cause is a poor user experience or a value gap, and shows where action may produce the strongest recurring revenue return.
Churn Prediction runs daily, refreshing the current at-risk population so teams can see which subscribers require attention and whether risk is increasing or declining.
Churn Analytics show where churn has occurred. Churn Prediction shows where action can protect revenue now.
![]()
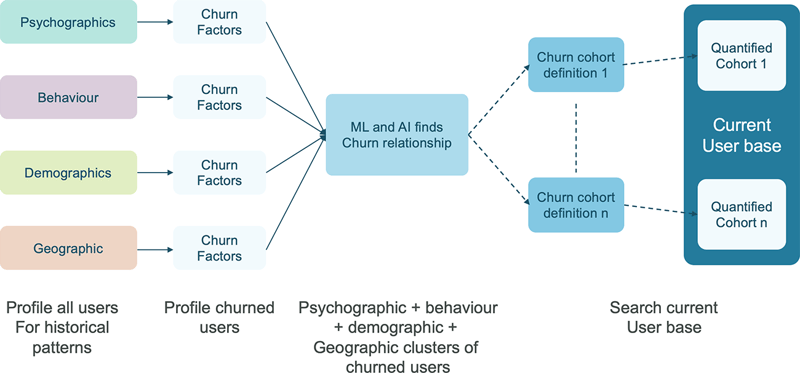
Churn Analytics identifies combinations of application experience, usage, network, device, location, and customer behavioral signals that appeared before subscribers left. Churn Prediction hunts for those patterns across the current subscriber base and identifies the groups that need attention.
For each at-risk segment, AppLogic helps show:
Prioritize subscribers by risk, likely cause, and potential revenue impact.
Immediate churn risk often appears when subscribers experience a serious decline in application performance. AppLogic identifies the affected segment and investigates the conditions behind the poor experience
AppLogic Networks uses various GenAI based techniques to find the most financially impactful churn relationships. These are usually found when looking at two or more dimensions. The more dimensions used, the more accurate the churn definition, but the smaller the cohort size.
Once churn relationships have been discovered, the next step is to analyse the current user base and find out who is currently within the same cohort and therefore at enhanced churn risk.
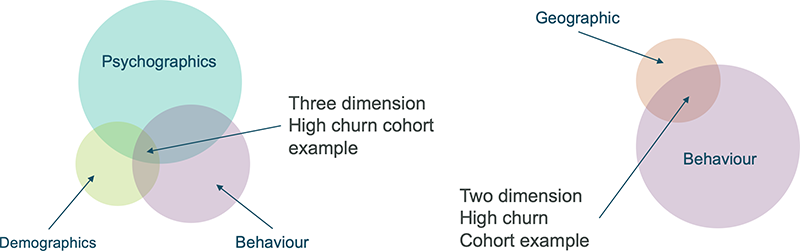
Respond to the cause of the poor experience instead of relying on a generic retention offer
AppLogic uses machine learning and AI to identify churn relationships across application interests, usage, behavior, location and service data. It then finds current subscribers who share the same patterns and estimates the financial size of the opportunity.
Find the value gaps that may limit growth before subscribers decide to leave
Marketing, Product, Retention, and Customer Experience teams can use these findings to improve a plan, create a more relevant offer, refine communication, or address a product gap for a defined segment.
Churn prediction runs daily so at-risk segments reflect the latest subscriber behavior and network conditions. Each refresh helps teams see whether risk is increasing or declining, measure the effect of completed actions, and update priorities as new evidence appears.
The results also strengthen future decisions. Teams can compare each action with changes in App QoE, subscriber activity, churn risk, and expected financial return. This evidence helps refine the next response and shows whether the program is contributing to revenue growth.
Value Related Risk
Marketing, Product, Retention, and Customer Experience teams receive segments associated with plan, price, offer, communication, or other value concerns.
User Experience Risk
Network Operations and Planning receive segments associated with cell sites, network elements or other network topology along with there expected financial impact.
A prediction becomes more valuable when it reaches the team that can address the likely cause.
A high churn risk does not automatically justify an expensive intervention. AppLogic helps decision makers compare the size of the affected segment with the expected cost and impact of a proposed response.
A Churn ROI Model includes:
AppLogic Networks models user experience and value-related opportunities separately. The result supports planning and prioritization; actual results depend on the operator's data and execution.
Invest where the expected recurring revenue benefit justifies the action.
Customer profile:
| Subscribers | 2,000,000 |
| Monthly loses | 1% |
| Monthly gains | 0.96% |
| ARPU | $20 |
Model inputs:
| Poor User Experience stream size | 20% |
| Poor perceived value stream size | 80% |
| Fix rate of poor user experience | 10% |
| Fix rate of poor perceived value | 5% |
Expected additional annual revenue during first 12 months: $1.87M
Customer profile:
| Subscribers | 12,000,000 |
| Monthly loses | 1.1% |
| Monthly gains | 1.15% |
| ARPU | $15 |
Model inputs:
| Poor User Experience stream size | 15% |
| Poor perceived value stream size | 85% |
| Fix rate of poor user experience | 5% |
| Fix rate of poor perceived value | 5% |
Expected additional annual revenue during first 12 months: $7.7M
The modeled churn reduction changes monthly subscriber performance from a net loss of 800 subscribers to a net gain of 400.
The modeled churn reduction more than doubles monthly net subscriber additions from 6,000 to 12,600.
These models only include the possible additional revenue. Second order benefits, such as reducing spend on Customer Acquisition, are not part of the calculations. The rate that User Experience and Value issues are fixed is dependent on the Service Providers taking actions.
NOTE: ROI models are only designed to give an indication of what can be possible and are not a guarantee of performance.
Device or CPE related churn
When poor App QoE is concentrated among users of a specific device, teams can target diagnostics, replacement, or proactive support toward the affected group.
Location or User Experience
When poor application experience is heightened in a defined area, Network Operations and Planning can prioritize investigation or planned improvements based on subscriber and revenue impact.
Plan or Service Value based churn
When subscribers receive a good user experience but show a raised value gap, Marketing and Product teams can review the plan, offer, or message for that segment without applying a broad discount to the full customer base.
Lower Return Opportunities
When the expected return from an intervention is low, the operator can monitor the segment or select a lower-cost response while protecting budget for stronger opportunities.
AppLogic Churn Prediction gives operators a daily, financially grounded view of where action can protect recurring revenue and increase net subscriber growth. Predicting and reducing preventable churn allows more new sales to expand the subscriber base instead of replacing revenue that has already left.
Reduce preventable churn so every new subscriber contributes more to top line growth.

Churn Analytics explains historical patterns in known churn outcomes. Churn Prediction applies those patterns to the current subscriber base to identify where action may have the greatest value.
The model uses App QoE, network KPIs, application usage, device information, behavior, location, account context, and other data available to the operator.
AppLogic runs churn prediction daily, refreshing at-risk segments so teams can work from current data and track progress over time.
A useful prediction includes a likely cause and supporting context. AppLogic separates measurable user-experience problems from value-related concerns so the results reach the right team.
Reducing preventable churn allows more new customer additions to increase the subscriber base. Prediction helps focus time and spending on the segments where action may produce the strongest recurring revenue return.
AppLogic enables the comparison of the size and value of an at-risk segment with the expected impact and cost of a proposed action. The model supports planning and prioritization rather than guaranteeing a specific result.